Deeksha Chamola
(Research Scholar, SOJNMS, IGNOU & Coordinator,
Department of Mass Media, Mithibai College,
Mumbai University)
Introduction
Social networking sites as part of Web2.0 have changed the way human beings communicate. The term Web2.0 defines websites that are designed to: “(a) rely on the participation of mass groups of users rather than centrally controlled content providers, (b) aggregate and remix content from multiple sources, and (c) more intensely network users and content together” (O’Reilly, 2007, Ahn June 2011, p 1). Mass media is no more a one-way communication; it has become two-way and it engages the user in somewhat the same way it does in face-to-face communication. Delayed and limited feedback, the disadvantage of mass media, has also been overcome by this new media. According to Castells (2007); Manovich (2009); (Dijck, 2013) p 5, the Web2.0 services were started soon after the dawn of the new millennium which changed the “networked” communication to “interactive, two-way” communication for a connected society.
What are social networking sites?
Social networking sites popularly known as SNS are part of the Web2.0 revolution. These are one of the social media platforms which abet the user/member to connect with her/his family and friends online. Ahn June (pp 3) points out that “these three features-profiles, friends, traversing friend lists-represent the core, defining characteristics of SNS”. SNS is different from the earlier chat rooms where primarily new relations were formed with unknown people in the virtual world. The real-world friends used to interact in those chat rooms but there was no network as such, only group chats with known people were possible. SNS connects an individual with his family members and friends and also to friends of friends and unknown people. According to Burke (2011), social networking sites are meant to interact with friends and families and forge new and strong ties. The user needs to construct a profile on these sites, declaring their demographic details, hobbies, and interests, etc. and search for their family members and friends. And they get started by status updates, pictures, video uploads, commenting, liking, sharing, tweeting, poking, etc.
Research design
The aim of this research is to examine the social networking site usage pattern among adolescents residing in Mumbai. A descriptive research design has been selected in order to understand the usage behavior of SNS. Through quantitative analyses, the researcher has explained the occurrence of the variables in question. For quantitative analyses, the researcher had selected group-administered surveys. The universe of the study was Shri Vile Parle Kelvani Mandal’s colleges such as Narsee Monjee, NMIMS, Mithibai, Usha Parveen Gandhi, Jitendra Chauhan College of Law. 230 respondents between 15 years and 19 years studying in these colleges were randomly selected in January 2014.
Demographic analysis
| Variables | N | Mean | Median | Mode | SD |
| Gender | 230 | 2 | |||
| Age | 230 | 3.02 | 3.00 | 2 | 1.298 |
| Salary | 230 | 3.03 | 3.00 | 2 | 1.257 |
Figure 1- Demographic data

Figure 2- Gender Analysis
The total sample size of the study was 230 out of which 132 (57.4 percent) were female and 98 (42.6 percent) were male with a standard deviation of 0.468. The sample comprised of more females than males. This may indicate that the female population was more in the courses from which the sample was drawn.
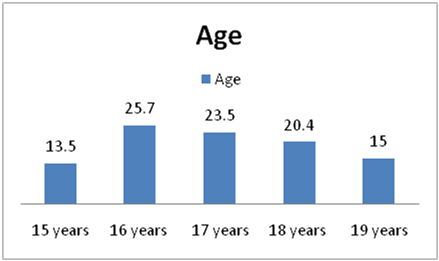
Figure 3 Age Analysis
13.5 percent of the respondents were 15-year-olds, out of which 7.8 percent were female and 5.7 percent were male. However, 25.7 percent respondents were of 16 year age, out of which 13.9 percent were female and 11.7 percent were male, 23.5 percent respondents were of 17 years out of which 13 percent were female and 10.4 percent male, 20.4 percent were of 18 years out of which 13.9 percent were female and 6.5 percent were male. 17 percent of respondents were 19 years of age out of which 8.7 percent of respondents were female and 8.3 percent were male.
Standard of living
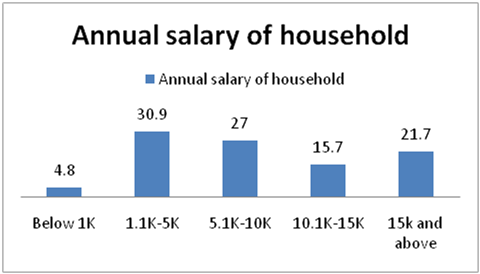
Figure 4 – Income analysis
The average income of the household is 3.19, 3 being the numeral designated to salary bracket between Rs5 lakh to 10 lakhs. However, out of 230 respondents 70 respondents (31 percent) household income is between Rs1 lakh to 5 lakhs. 57 percent of respondents’ household income was between Rs1 lakh andRs10 lakhs. The majority of the sample falls in the income bracket of Rs1 to 10 lakhs, out of which maximum (31 percent) earn between Rs1 lakhs andRs5 lakhs. This shows that the sample has a fair representation from the income levels. 5 percent of the respondents were from the lower class, 31 percent from the lower middle class, 27 percent from middle-middle class, 16 percent from the upper-middle class, and 21 percent from the lower upper class and above. The data reflects that the opinion of every income section of society has been subjected to scrutiny through this study.
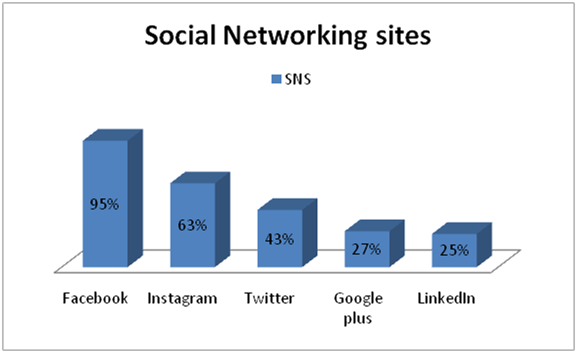
Figure 5 – SNS popularity
All the 230 respondents had their accounts with one or the other social networking sites. 95 percent of the respondents had at least one of their accounts on Facebook. Facebook emerged as the most preferred and popular social networking site among late adolescents. Facebook was followed by Instagram (63 percent), Twitter (43 percent), Google Plus (27 percent), and LinkedIn (25 percent). However, it should be noted that 26 percent of the population questioned had their account on only one social networking site i.e., Facebook. It shows a clear monopoly and the popularity of Facebook. Besides, 3 percent of the respondents had only one account on Instagram and 2 percent of respondents had a Twitter account. The majority of respondents have accounts on more than one networking site.

Figure 6- Preferred SNS accessing the place
The above pie chart shows the place where the adolescents preferred to access social networking sites. 51 percent of the respondents said that they preferred accessing SNS at home followed by 32 percent who reported to access social networking sites anywhere. However, 9 percent used SNS at home and college both and 6 percent used SNS at home and at friends’ place. The other place like the café got negligible preference.

Figure 7 – Preferred SNS accessing the medium
The figure depicts the preferred medium for accessing a social networking site among older adolescents. No single medium emerged as the most preferred over the other but 42 percent of respondents reported mobile phones and laptops as the most used medium. However, the mobile phone was favored by 35 percent of the respondents. This means that out of 230 respondents only 35 percent population used mobile phones to access SNS. 9 percent of the respondents access the SNS through all the above-mentioned mediums.
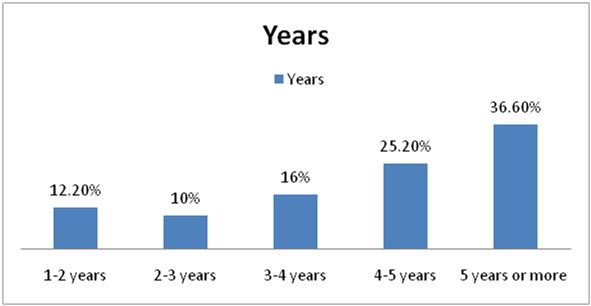
Figure 8- Years on SNS
53 percent of the respondents had their social networking sites accounts operational for more than five years; 25 percent were on SNS for the last four to five years. 22 percent said that they had their SNS account for less than three years. This data clearly indicates that the majority (78 percent) of respondents are using SNS for at least four years.
Social networking site usage intensity

Figure 9- SNS usage intensity
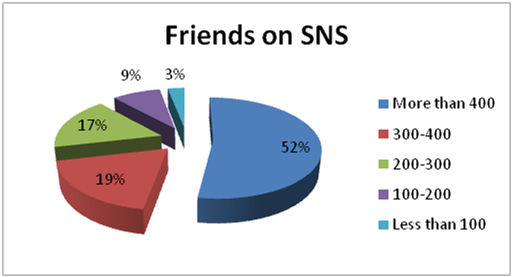
Figure 10 – Total number of friends on SNS
The above chart indicates that 52 percent of the respondents had more than 400 friends on Facebook. 19 percent of respondents said they had 300-400 friends on Facebook whereas 17 percent of respondents reported having 200 to 300 friends on Facebook. Only 12 percent had less than 200 friends on Facebook. The respondents who reported more than 400 friends were further asked to mention the exact number of friends on SNS. Out of 119 respondents who reported more than 400 friends, 56 percent had friends above 800, 20 percent had between 600 and 800 friends, and 24 percent of respondents had between 400 and 600 friends.
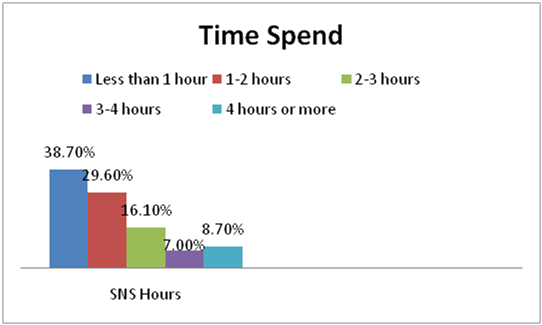
Figure 11- Time spend graph
38.70 percent of respondents reported having spent less than one hour on an average daily on SNS; 29.60 percent of respondents said that they dedicate one to two hours daily on an average on SNS; 31.8 percent of respondents reported spending at least two hours or more on SNS.
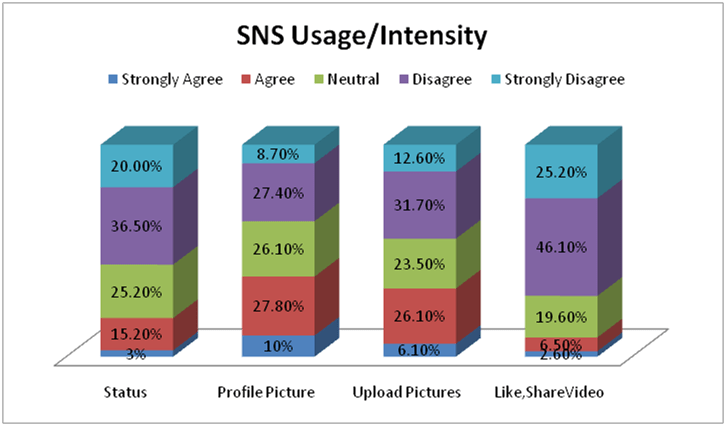
Figure 12-SNS usage intensity graph – I

Figure13 – SNS usage intensity – II
In order to analyze the intensity of usage of social networking sites, five questions were asked using the Likert scale. “I rarely update my status message or voice my thoughts”: 3 percent respondents reported that they strongly agreed with the statement, 15.20 percent respondents agreed with the statement, 25.20 percent had a neutral opinion about it, whereas, 36.5 percent disagreed with the statement and 20 percent respondents said they strongly disagreed with the statement. The majority of the respondents disagreed with the statement and believed that they frequently voice their thoughts and opinion through social networking platforms.
“I very frequently change my profile picture”: 10 percent of the respondents reported they strongly agreed to change the profile picture, 27.80 percent respondents agreed with the statement, 26.10 percent respondents had a neutral opinion about it, 27.40 percent respondents said that they do not frequently change their profile picture and 8.70 percent adolescents strongly disagreed with the statement. Here too the data is more skewed towards adolescents changing the profile picture frequently.
“I rarely upload pictures on internet” (reversed): 6.10 percent of adolescents strongly agreed with the statement, 26.10 percent respondents reported to agree with the statement, 23.50 percent adolescents had a neutral opinion about the same, 31.70 percent respondents disagreed that they rarely upload pictures on the internet whereas, 12.60 percent respondents strongly disagreed with the statement. The majority (44.3 percent) adolescents disagreed that they rarely upload pictures on the internet. Though the difference in percentage is not much, it can be considered that neutral respondents were more skewed toward the variable being tested.
“I rarely like and share others’ videos” (reversed): Out of 230 respondents 2.60 percent strongly agreed with the statement, 6.50 percent of respondents agreed, 19.60 percent respondents were neutral, 46.10 percent respondents did not agree with the statement and 25.20 percent strongly disagreed with the statement. 71.30 percent of respondents believed that they frequently like and share others’ videos on social networking sites. The data indicate that respondents are more inclined towards liking and sharing other people’s videos.
“I rarely follow any celebrity on SNS”: 6.10 percent respondents strongly agreed that they rarely followed any celebrity, 19.60 percent respondents agreed with the statement, 19.60 respondents reported that they were of neutral opinion whereas 33.90 percent of respondents disagreed with the statement and 26.10 percent respondents reported that they strongly agreed with the statement. 60 percent of respondents reported following a celebrity on social networking sites. The data shows that the majority of respondents prefer to follow celebrities on SNS.
“I daily chat with friends on SNS”: 16.10 percent respondents reported that they chat daily with friends on SNS (strongly agreed with the statement), 20.40 percent respondents agreed with the statement, 18.30 percent respondents were of neutral opinion, 36.50 percent respondents disagreed that they chat daily and 8.30 percent strongly disagreed with the statement. 44.8 percent did not chat daily on SNS; the data is skewed towards not using SNS as a medium of personal communication daily.
“I feel out of touch if I do not log in daily on SNS”: 16.10 percent of respondents out of the complete sample strongly agreed with the statement, 30.90 percent of respondents agreed that they felt out of touch if they do login daily on SNS. 17.80 percent were of neutral opinion about the statement. 27 percent of respondents disagreed with the statement and 8.30 percent of respondents strongly disagreed with the statement. The data reflects that though the adolescents prefer other chat mediums to interact now majority 47 percent feel out of touch if they do not log in once a day.
“I do not use SNS frequently much because it hampers my studies”: Only 3 percent of respondents strongly agreed with the fact that spending time on social networking sites hampers their studies that is why they do spend much time on them. 12.60 percent of respondents agreed with the statement, 24.30 percent were of neutral opinion. 45.70 percent disagreed with the statement and 14.30 percent of respondents strongly disagreed that spending time on SNS did not hamper their studies. It should be noted here that the majority (60 percent) adolescents do not think that spending more time on SNS can hamper their studies. It indicates that it has become one of their routine habits.
“Most of the time on SNS, I check out what other people are up to”: 15.20 percent of respondents strongly agreed with the statement. 41.7 percent of respondents said they agreed with the fact. 20.90 percent were of a neutral opinion. 14.80 percent disagreed and 7.40 percent strongly disagreed. The majority of respondents (56.9 percent) agreed that most of the time they check out what other people are up to. This depicts that most of the time SNS is used to peep into other people’s life.
Conclusion
The majority of respondents belong to the middle-income group and the most popular social networking site among them is Facebook followed by Instagram. The majority of them use SNS through mobile phones and laptops. Most of them have more than 400 friends on these sites and have been using them for more than five years. A majority of adolescents spent more than four hours on the internet and their time spent on social networking sites has reduced over the years. There are more light users than moderate and heavy users of social networking sites. All the uses of these sites have decreased and most of the time adolescents on these sites check out what other people are up to, share videos and upload their pictures. Personal chatting on these sites has decreased over the years, maybe because of a rise in mobile messaging applications. However, it is still used as a medium of expression when the user needs to reach a larger network. The use of SNS has become a habit and the majority of respondents believed that the user does not hamper their studies.
References
- Ahn June (2011), The effect of social networking sites on adolescents’ social academic development: Current theories and controversies, Journal of the American Society for Information Science and Technology
- Phulari SS (2010), Understanding the Formulation of Social Capital in Online Social Networking Sites. International Journal of Computer Science Issues, Vol. 7, Issue 1, No. 3
- Lin Nan (1999), Building a Network Theory of Social Theory, XIX International Sunbelt Social Network Conference, Charleston, South Carolina, February 18-21,1999
- Steinfield Charles et al (2009), Bowling Online: Social Networking and Social Capital within the Organization, C&T’09, June 25-27, 2009, University Park, Pennsylvania, USA., ACM 978-1-60558-601-4/09/06.
- Steinfield Charles et al. (2012), Online Social Network Sites and the Concept of Social Sites, presentation at The Internet Turning 40 Conference School of Journalism and Mass Communication Chinese University of Hong Kong
- Barker Valerie et al. (2013), Facebook “Friends”: Effects of Social Networking Site Intensity, Social Networking Site Intensity, Social Capital Affinity, and Flow on Reported Knowledge-Gain, The Journal of Social Media in Society 2(2), Fall 2013
- Burke et al. (2011), Social Capital on Facebook: Differentiating Users and Uses, CHI 2011, May 7-12, 2011, Vancouver, BC, Canada.
- Ellison Nicole et al. (2006), Spatially Bounded Online Social Networks and Social Capital, Paper to be presented at the Annual Conference of the International Communication Association (ICA), June 19-23, 2006 in Dresden, Germany
- Steinfield Charles (2007), The Benefits of Facebook ”Friends:” Social Capital and College Students’ Use of Online Social Network Sites, Journal of Computer-Mediated Communication 12 (2007) 1143-1168, International Communication Association
- HargittaiEszter (2008), Whose Space? Differences Among Users and Non-Users of Social Network Sites, Journal of Computer-Mediated Communication 13 (2008) 276-297
- Valenzuela Sebasti’ a (2009), Is There Social Capital in a Social network site?: Facebook Use and College Students’Life Satisfaction, Trust, and Participation1Journal of Computer-Mediated Communication 14 (2009) 875-901 © 2009 International Communication Association
- Hampton N. Keith et al. (2011), Social networking sites and our lives, Pew Research Center’s Internet and American Life Project
- Steinfield Charles et al. (2011), Social capital, self-esteem, and use of online social network sites: A longitudinal analysis, Journal of Applied Developmental Psychology 29 (2008) 434-445
