Prof. Achyut Vazé*
TV in India made its humble beginning 50 years ago in 1965. By 2015, it had expanded into an extremely powerful medium reaching out to 61 per cent of homes in India and is expected to grow at a compound rate of 14 per cent per annum in the years to come, outpacing significantly the Indian economy itself, according to FICCI-KPMG Report on Indian Entertainment Industry 2015.
Yet, Indian television remains one of the most under-studied subject areas today. Apart from some impact and effect studies, there are very few studies on TV broadcasting in the country befitting its growth in this sub-continent.
Substantial work has been done in the field of quantifying the size of viewership for different TV programs with detailed data available on viewer profiling by age, sex, location and socio-economic class. This “TV Ratings (TVR)” data [earlier labeled TV Rating Point (TRP) data] is used by the industry as the ultimate measure of the success of a program or a channel. However, very little work has been done so far in terms of understanding the factors influencing viewer preferences.
Analyzing viewer preference
TV audience measurement system in India has come a long way but is still riddled with problems such as:
- Sampling issues
- Linguistic/ cultural diversity in India
- Differing perspectives of stake-holders
Despite its limitations, TV Rating (TVR) continues to be used as the ultimate arbitrator by the industry to measure viewership of a programme or a channel as TV Rating determines the revenue a broadcaster generates.
Can TV ratings be predicted
Program selection by a broadcasting channel is based on channel executives predicting in their own way the rating generating potential of a programme. A common method used is watching “Pilot” episodes of a new serial and “assessing” likely TV ratings that it can generate. Sometimes, mini sample surveys of viewers are conducted to find out whether viewers “Like/ Do not like” the Pilot. But rarely do the researchers go beyond and try to explore the factors of viewer like or dislike.
This researcher has tried to understand the factors behind the “liking” by the viewer in order to move towards a model that can predict the ratings in a relatively more scientific way.
Questions explored
- What are the Determinants of Viewer Preference (DVP), a term coined by this researcher for TV programs telecast in India?
- What are the relative weights assigned by the audience for each DVP?
- Can a “Viewer Preference Index” (VPI), a term also coined by this researcher, thus constructed be an indicator of the TV ratings (TVR) the program will eventually generate?
As a first step towards answering these questions, the present study decided to have a series of discussions with domain experts from major stakeholder segments in the industry such as Program Producers and Broadcasting Channels. Viewer segment was not included at this stage. A panel of 18 industry practitioners, mostly Mumbai-based, was interviewed individually to understand the processes involved.
This was followed by three Focus Group surveys of viewers, two in Mumbai and one in Pune, with group sizes varying from 8 to 14 participants. It was decided to restrict this study to the largest category of TV broadcasting channels, viz Hindi General Entertainment Channels (GEC) constituting 31.2 per cent of total TV viewership in India and the “daily soap” genre was chosen being the most dominant genre within the Hindi GEC category (FICCI-KPMG 2015).
The Focus Group discussions revealed certain common factors that determined viewer choices. These factors were later used in a formal Viewer Survey with structured questionnaires. Convenience-based sampling in Mumbai and Pune was used for the purpose that yielded an effective sample size of 243 respondents.
Viewer preference determinants
The various factors affecting viewer preferences identified by domain experts were classified into two groups. (Terminology coined by this researcher):
- Content External Determinants (CED)
- Content Intrinsic Determinants (CID)
Content external determinants
The most important Content External Determinant of viewer preference highlighted by industry experts was the “Marketing & Promotion” dimension. It was unanimously agreed by the experts interviewed that effective marketing and promotion on screen as well as off screen (such as hoardings) helps tremendously in “launching” a new show and getting good viewership for the initial episodes. However, the experts also opined that this effect wears off if the “product is not good”. While launch promotion does help “trial” of the product/ program, it seems that “content-intrinsic” factors take over viewer preference once the initial trial period is over. Similarly, according to experts, the impact of other content-external factors such as scheduling, a show’s life-cycle etc wears off in the medium term and content-intrinsic factors take over.
Content intrinsic determinants
Content Intrinsic Determinants (CID) of viewer preference are factors that are part of the program content itself such as its story or concept or actors. Initial Focus Group discussion yielded about eight Content Intrinsic Determinants of viewer preference. After two more Focus Group discussions the list was shortened to five factors:
- A good story line
- Strong characters
- Dealing with important issues
- Good performances
- Good production values
Survey with structured questionnaire
The Content Intrinsic Determinants as revealed by the Focus Groups were then taken to a larger sample of viewers with a structured questionnaire. The survey was conducted in four languages Hindi, Marathi, Gujarati and English and the respondent was given a choice of using his language. The questionnaire had three parts:
- A brief bio-metric profile of the respondent
- Ranking Content Intrinsic Determinants from their perceived importance
- Selecting soaps liked/ disliked from the list given and grading them on the Content Intrinsic Determinants identified earlier.
Viewer preference determinant scores
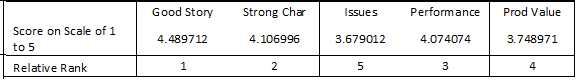
Respondents ranked Content Intrinsic Determinants from their perceived importance on a scale of 1 to 5, 1 being “not relevant” and 5 being “extremely relevant”.
“Good story line” received the highest score and rank 1, followed by “strong characterization” and “performances of actors”. “Issues tackled” and “production values” received relatively lower scores. (See Table 1).
Table 1: Viewer Preference Determinant Scores (VPDS)
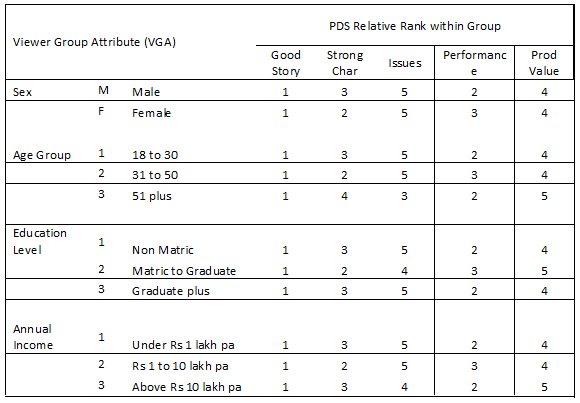
- “Good story line” continued to be the most important CID across different VGA’s such as age, sex, income and education levels
- “Strong characterization” and “good performances” are the second-most important CID but their importance depends on the VGA
- “Production values” and “issues dealt with” are relatively less significant CID but their importance also varies with the VGA.
Table 2: Viewer Preference Determinant Scores (VPDS) by Viewer Group Attribute (VGA) on a Scale of 1 to 5

The corresponding relative ranking makes the data more comprehensible as presented in Table 3.
Table 3: Viewer Preference Determinant Scores (VPDS): Relative Ranks by Viewer Group Attribute (VGA)
Viewer preference predictive model
Having identified five critical Content Intrinsic Determinants of viewer preference of daily soaps and also the importance or the “weights” viewers with different group attributes attached to each of these determinants, the next issue was whether this information can be used for creating a model by which viewers’ preferences can be broadly predicted. For that we had to select programs and ask sample viewers to grade the selected programs using these determinants and correlate survey results with external market data on program ratings.
Grading programs on CID
As mentioned earlier, the most dominant genre in the Indian context, Hindi daily soaps was taken as a case study.
40 different daily soaps shown on major channels were selected and the respondents were asked to grade the most liked and most disliked soaps on the Content Intrinsic Determinants (CID) identified. The idea behind asking respondents to grade both the most liked and disliked soaps was to get the entire range of high and low scores on each CID.
For each viewer surveyed therefore we had data on
” Importance assigned to the five different CID’s given (such as “story” “production values” etc) independent of which particular soap he watches; and
” Grades on a scale of 1 to 10 on each of the five CID’s given for the soaps that he has watched (whether “liked” or “disliked”)
By using the importance assigned to each CID as a “weight” to the grades he assigned to each soap that he watched we calculated his weighted preference index for that soap.
Viewer Preference Index (VPI) was then created by this researcher for each soap using weighted average scores given by respondents for that particular soap.
Relationship between viewer preference index and TVR
Viewer Preference Index (VPI) for each soap thus calculated using data from this survey was then compared with actual TV rating data (TVR) as given by external industry agency for that particular soap. The purpose was to examine if any correlation exists between our VPI and external TVR. A quick summary of the findings is given in Table 4.
Table 4: Relationship between Viewer Preference Index and TVR

A viewer preference predictive model
The data indicated that there is a strong relationship between
- Viewer Preference Index (VPI), calculated on the basis of preferences revealed by viewers surveyed duly weighted by the importance they attach individually to different Content Intrinsic determinants (CID), on the one hand and
- Actual Television Rating Points (TVR) used by industry stake-holders for evaluating different daily soaps, on the other
The coefficient of correlation between the VPI calculated by us and TVR obtained from external sources is high at 0.8537
The implication is that VPI calculated by the model suggested in this study seems to be a good indicator of TVR’s and thus can potentially be used for predicting the same.
Limitations of the study
- The sample used in the survey (243 respondents) may be too small
- The sample may have an urban bias, Western India bias and higher income bias
- The sample is not stratified on the basis of different Viewer Group Attributes (VGA) such as income, education etc to match with VGA in the universe of Indian TV households.
Scope for further study
It would be useful to conduct a similar study with a larger stratified sample and more rigorous statistical analysis. It would be useful to conduct a similar study for major languages other than Hindi and for programs other than daily soaps.
